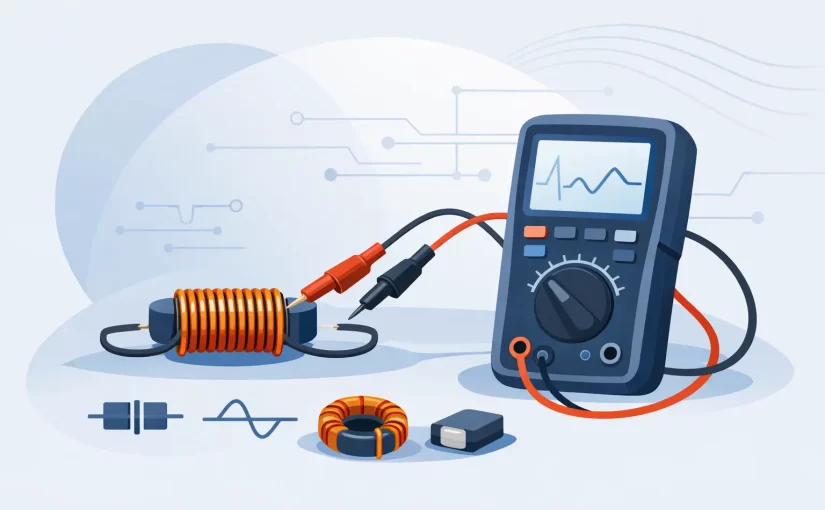
A 10 uH inductor can look entirely different at 1 kHz and 100 kHz. It can also measure incorrectly when long leads add impedance, when a ferrite core approaches saturation, or when a nearby circuit path is still connected. To measure inductors with LCR meter results you can trust, the meter, test frequency, fixture, and measurement condition must match the part and the question being asked.
An LCR meter does more than display inductance. Depending on its configuration, it can report inductance (L), series resistance (Rs), parallel resistance (Rp), quality factor (Q), dissipation factor (D), impedance magnitude, and phase. Those values provide the information needed to identify a loose component, compare incoming parts, troubleshoot a PCB, or determine whether an inductor has changed under operating stress.
Start With the Inductor Specification
Before selecting a test frequency, identify the nominal inductance, tolerance, rated current, intended operating frequency, and core material if available. A power inductor specified at 10 uH at 100 kHz may not produce the same displayed value at 1 kHz. A small RF choke may be specified at a different frequency entirely, often with Q as a critical parameter.
Inductance is not a fixed value across all conditions. The core permeability changes with frequency, AC excitation level, temperature, and DC bias. The winding also has resistance and parasitic capacitance. As frequency rises, these parasitics become increasingly significant, particularly for compact multilayer, wire-wound, and high-Q inductors.
For acceptance testing, use the manufacturer’s stated test condition whenever possible. If a data sheet specifies 100 kHz, 0.1 V RMS, and zero DC bias, that is the condition most likely to produce a meaningful comparison. Measuring at an arbitrary frequency can still be useful for sorting or troubleshooting, but it should not be treated as direct verification against the data sheet.
Configure the LCR Meter Correctly
Select an Appropriate Test Frequency
Low-frequency measurements, such as 100 Hz or 1 kHz, are generally useful for larger power inductors and components intended for lower-frequency filtering. Higher test frequencies are more suitable for small inductors, RF chokes, and switching-regulator components specified at 10 kHz, 100 kHz, or above.
A higher frequency is not automatically better. It can reveal winding capacitance and self-resonant behavior rather than the low-frequency inductance value expected from the nominal marking. Conversely, a meter limited to low test frequencies may not adequately characterize a small inductor designed for high-frequency service.
Professional handheld instruments with test frequencies up to 100 kHz or 250 kHz allow technicians to examine this frequency dependence directly. A reading that remains stable across practical test frequencies is usually more reassuring than one measurement taken under unknown conditions.
Choose Series or Parallel Equivalent Mode
LCR meters model real components with equivalent series or parallel circuits. For most inductors with relatively low loss, series mode is the practical starting point. In series mode, the instrument reports inductance with equivalent series resistance, commonly shown as Ls and Rs.
Parallel mode can be useful for high-impedance inductive components or when the application and data sheet use a parallel model. If the displayed inductance changes substantially between series and parallel mode, inspect the associated resistance, Q, and test frequency. That difference often indicates that losses or parasitic capacitance are influencing the result.
There is no universal rule that every inductor should be tested in only one mode. Match the mode to the component specification, then document it. Repeatable measurement conditions matter more than a default selection.
Set a Suitable Test Level
The LCR meter’s AC test signal can affect inductors with magnetic cores. A high excitation level may shift the core into a nonlinear region and produce a lower apparent inductance. This is especially relevant for ferrite power inductors and current-sense chokes.
Use the specified test voltage or current where it is known. For comparison measurements, keep the level constant. If a component’s inductance drops as test level rises, that may be expected core behavior, but it can also indicate that the chosen condition is too aggressive for a basic bench measurement.
Compensate the Fixture Before Connecting the Part
Open and short compensation removes much of the error introduced by leads, probes, and test fixtures. It is particularly important when measuring low-inductance parts, where a few centimeters of wire can contribute enough inductance to distort the result.
Perform open compensation with the probes separated in their normal measurement position. Perform short compensation using the meter’s recommended shorting method, ideally at the exact probe tips or fixture contacts used for the component. Repeat compensation after changing frequency, test leads, adapters, or measurement geometry.
For surface-mount inductors, direct-contact probing reduces lead length and handling time. Tweezer-style probes also help maintain consistent contact pressure on small terminals. On very low-value components, keep the conductive path as short and symmetrical as possible. A loose alligator-clip setup may be adequate for a millihenry choke, but it is rarely the best choice for a small RF inductor.
Measure Loose Inductors First
A loose part provides the cleanest measurement because the meter sees only the component and fixture. Remove oxidation from leads if necessary, grip both terminals firmly, and avoid touching exposed metal contacts with your fingers. Your body capacitance and contact resistance can affect higher-frequency measurements.
Record more than the inductance value. For a typical series-mode measurement, capture Ls, Rs, Q, test frequency, and test level. Rs is useful because a damaged winding, poor solder joint, or substituted component may have a similar inductance but higher loss. Q provides another view of loss, since a higher Q generally indicates lower resistive loss at the selected frequency.
A low Q result is not automatically a defect. Shielded power inductors and ferrite components often have modest Q compared with air-core or RF inductors. The relevant question is whether the measured value agrees with the component’s intended class and specification.
Measure Inductors With an LCR Meter on a PCB
In-circuit measurements are fast, but they require judgment. An LCR meter applies an AC test signal, and surrounding components may create parallel or series paths that alter the displayed result. A capacitor across the inductor, a semiconductor junction, a low-resistance supply rail, or another magnetic component can all influence the measurement.
Start with the board unpowered and discharged. Confirm that stored energy is removed from large capacitors before contacting the circuit. Then place the probes directly on the inductor terminals, not on distant solder joints connected by long traces.
If the in-circuit value is close to expectation and repeatable, it may be sufficient for fault isolation. If it is low, unstable, or clearly inconsistent with the marked value, lift one terminal and measure again. Removing one connection breaks many parallel paths while minimizing rework. Full component removal is warranted when the circuit topology still affects the reading or when the part is being evaluated for quality control.
For PCB diagnosis, compare identical locations on a known-good board when possible. This is often faster than interpreting a single absolute number. A suspect inductor that reads 40 percent lower than matching inductors under the same meter settings deserves further investigation, even before a data sheet is located.
Watch for Self-Resonance and Core Saturation
Every wound inductor has distributed capacitance. At its self-resonant frequency, the inductive and capacitive reactances interact, and the part stops behaving as a simple inductor. Above resonance, it can appear capacitive. An unexpected negative phase angle, unstable inductance reading, or dramatic value change at higher frequency can indicate that the test frequency is approaching self-resonance.
Core saturation is a separate effect. DC current through a power inductor reduces effective permeability and therefore inductance. Most handheld LCR measurements use a small AC signal without the operating DC bias, so they cannot alone verify inductance at full load current. Use the LCR meter to establish zero-bias characteristics, then use a controlled DC-bias setup when saturation performance is the actual requirement.
Interpret the Result in Context
A correct inductance measurement is a condition, not merely a number on a display. A 47 uH reading at 1 kHz in series mode may be accurate, while a different result at 100 kHz may also be accurate for that same part. What matters is whether the measurement condition matches the specification or the diagnostic objective.
For component identification, nominal inductance and physical package may be enough. For incoming inspection, use specified frequency, test level, tolerance, and loss limits. For repair work, combine inductance with DCR, Q, visual inspection, and comparison to a known-good circuit. A meter with stable high-frequency LCR capability and direct SMD access, such as a Siborg Smart Tweezers instrument, can shorten this process by reducing fixture changes and probe placement errors.
When a reading does not make sense, do not immediately assume the inductor has failed. Verify compensation, shorten the connection path, change the test frequency, inspect for parallel circuitry, and measure the part out of circuit if needed. That disciplined sequence turns an LCR meter from a component checker into a practical diagnostic instrument.