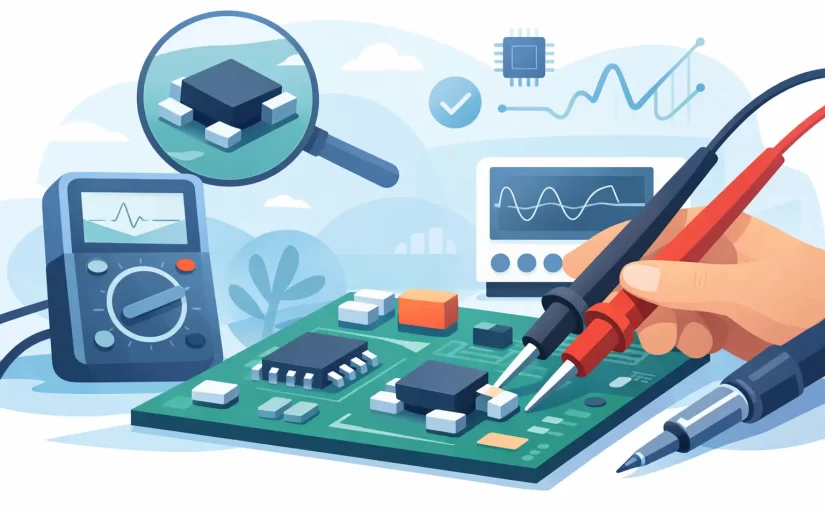
How to Test SMD Components on Board Accurately

A 0402 capacitor can appear shorted even when it is good. A 10 kOhm resistor can measure 4.7 kOhm because another circuit path is in parallel. An inductor can look like a low-value resistor at DC. These are normal consequences of working on populated PCBs, not necessarily instrument errors. To test SMD components on board effectively, the technician must separate a component’s expected behavior from the behavior of the circuit around it.

In-circuit measurement is one of the fastest ways to locate a fault, screen a suspect area, or compare one channel with another. It is not a substitute for understanding the schematic, power topology, and nearby semiconductor junctions. The best results come from using the right measurement mode, suitable test frequency, stable contact, and a clear decision about when one component lead must be lifted.

How to Test SMD Components on Board

Start with the board de-energized unless the diagnostic requires a powered voltage measurement. Disconnect external supplies, batteries, and cables that may backfeed the circuit. Large electrolytic and polymer capacitors should be discharged using an appropriate method before connecting an LCR meter, ESR meter, or tweezer probe. A board that appears off can still retain damaging energy on a high-voltage rail.

Inspect the area before measuring. Flux residue, corrosion, damaged pads, cracked MLCCs, and solder bridges can change the reading or prevent reliable contact. Check the reference designator and package markings, then compare the component with an equivalent location if the board has repeated channels. A known-good channel is often more useful than a nominal component value because it includes the intended surrounding circuit.

For small passive parts, tweezer-style probes provide a direct path to each termination. Keep the tips aligned with the component ends and avoid contacting adjacent pads. If the component is smaller than the probe-tip spacing, use fine probing accessories rather than forcing the tips together. Mechanical pressure can crack ceramic capacitors or shift small parts, particularly on reworked boards.

Measure resistors with the circuit path in mind

A resistor is the simplest in-circuit component to test, but its reading is often affected by parallel paths. A 100 Ohm resistor across a transistor base-emitter network, IC input, or another resistor may read lower than its marked value. A reading close to the expected value is usually meaningful. A lower reading is evidence to investigate, not immediate proof that the resistor has failed.

First use resistance mode to identify open resistors, severely shifted values, and low-resistance shorts. For values below a few ohms, lead and probe resistance become significant. Zero or compensate the instrument if that function is available, and use a stable two-point contact. On low-ohm current-sense resistors, measure several times and compare against the board’s known-good location or design tolerance.

A resistor that measures higher than its nominal value while installed deserves attention. Parallel paths usually lower resistance, so a high in-circuit reading may indicate an open connection, a cracked resistor, or a damaged trace. Confirm by probing the pad and trace on each side rather than assuming the component body is at fault.

Test capacitors using capacitance and ESR together

Capacitance alone rarely tells the complete story. A ceramic bypass capacitor may measure close to nominal capacitance while leaking or shorting under operating voltage. Conversely, its apparent in-circuit capacitance may be higher because multiple capacitors share the same rail. Electrolytic capacitors can retain adequate capacitance but develop ESR high enough to cause unstable regulators, ripple, or startup faults.

For a fast fault screen, test for a very low resistance or diode-like response from a supply rail to ground. Then use capacitance and ESR measurements where the circuit allows them. A capacitor on a quiet, isolated node is easier to assess than one placed directly across a power plane with many parallel capacitors.

MLCCs require particular care. Their capacitance varies with DC bias, temperature, and dielectric type, while a board-level LCR measurement is made at a small AC test signal. If an MLCC looks suspicious, compare it with a matching component in the same circuit section. Lift one end only when the board-level result conflicts with the fault symptoms or the design requirement.

Test inductors by separating DCR from inductance

Most power inductors have low DC resistance, so a multimeter may correctly show a near-short condition. That result does not establish that the inductor is shorted. Measure inductance at a suitable test frequency, then check DCR separately if the instrument supports it. An open inductor, a cracked termination, or a major inductance change can be identified quickly this way.

Nearby capacitors and switching devices can distort an in-circuit inductance measurement. A buck converter inductor connected between a switching node and output rail is especially difficult to characterize while installed. If the measured value is implausible, isolate one lead rather than relying on a reading dominated by the regulator’s MOSFETs, output capacitors, and control IC.

Select Test Frequency That Matches the Component

Test frequency affects the result. A capacitance measured at 100 Hz may not represent how that part behaves in a switching supply, RF bias network, or high-speed filter. Likewise, inductance values and impedance behavior can change substantially as frequency rises. Use the component datasheet and circuit function to choose a meaningful range.

For general board repair, a meter with multiple LCR frequencies provides more diagnostic value than a single-frequency measurement. A 1 kHz reading may be useful for common capacitors, while 100 kHz or 250 kHz testing can better expose behavior relevant to switching converters and small inductors. The goal is not to select the highest available frequency automatically. It is to compare readings under conditions that resemble the component specification or the operating circuit.

Siborg Systems instruments such as Smart Tweezers and LCR-Reader models are designed for this direct-contact workflow, combining component identification with LCR measurement in compact tweezer formats. When comparing instruments, verify basic accuracy, available frequencies, test signal levels, compensation functions, and calibration documentation rather than judging capability by capacitance range alone.

Know When an In-Circuit Result Is Not Valid

A component should be isolated when the circuit clearly dominates the reading. Common examples include capacitors across power rails, resistors tied to IC pins with internal protection structures, inductors in switching stages, and any part with a second parallel path. Semiconductor junctions can also cause an LCR meter or ohmmeter to report values that change when probe polarity is reversed.

Do not remove parts simply because a measurement is unexpected. First compare the result with the schematic, a matching channel, and the expected topology. If the reading still points to a fault, lift one termination. Lifting one end preserves the component for direct measurement while minimizing rework risk and pad damage.

For suspected short circuits, use a staged method. Measure rail-to-ground resistance, compare with a healthy rail or board, inspect with magnification, and then use controlled power injection only when the board and repair procedure permit it. An LCR meter is valuable for passive-component characterization, but it does not replace current-limited power diagnostics for locating a shorted IC or failed power device.

Improve Repeatability at the Probe Tips

Probe contact determines whether a precise instrument delivers a precise result. Clean oxidized solder, remove excess flux, and hold the probe tips still until the reading stabilizes. On tiny components, use a microscope or magnifier to confirm that each tip is on the intended termination. A tip touching a neighboring pad can create an apparently valid but completely irrelevant measurement.

Apply open and short compensation when the instrument and accessory arrangement support it. Compensation is especially useful for low inductance, low resistance, and small capacitance values, where probe parasitics can be comparable to the component being measured. Repeat the test after rotating the board or changing the approach angle if the value seems unstable.

The practical objective is not to prove every installed SMD component’s exact datasheet value without removal. It is to make a fast, defensible diagnostic decision: the part is consistent with the circuit, the part is clearly abnormal, or the circuit must be isolated for a valid measurement. That distinction keeps board repair moving while protecting both the PCB and the measurement record.

Semiconductor Device Simulation for Better Designs

A transistor can meet its nominal DC target and still fail the application because its capacitance, leakage, breakdown margin, or temperature behavior was not understood early enough. Semiconductor device simulation addresses that gap by calculating how a device structure responds to voltage, current, electric field, illumination, temperature, and process variation before wafers are committed or prototypes reach the bench.

For engineers developing diodes, MOSFETs, bipolar devices, sensors, LEDs, and power semiconductors, simulation is not a replacement for measurement. It is a way to make measurements more purposeful. A credible model identifies which dimensions, doping profiles, interfaces, and material parameters deserve attention, then provides predicted curves that can be checked against fabricated devices using calibrated test equipment.

What Semiconductor Device Simulation Must Represent

At device level, the calculation begins with semiconductor physics rather than a simple circuit symbol. The solver typically couples Poisson’s equation, which describes electrostatic potential, with carrier continuity equations for electrons and holes. Depending on the device and operating conditions, it may also include drift-diffusion transport, mobility models, recombination, bandgap narrowing, impact ionization, self-heating, tunneling, and optical generation.

The useful output is not merely a current-voltage curve. Engineers may examine electric-field concentration near a junction edge, carrier density through a channel, depletion width, local temperature rise, or recombination within an active layer. These internal quantities explain why a measured characteristic has the shape it does and where a design is likely to become unreliable.

Model selection matters. Drift-diffusion methods are efficient and appropriate for many conventional devices. Very short channels, high fields, wide-bandgap materials, cryogenic conditions, or structures where quantum confinement is significant may require more advanced transport or quantum corrections. Adding every available physical model is not automatically better. It increases run time, parameter uncertainty, and the risk of treating poorly characterized inputs as facts.

From Process Steps to Electrical Behavior

The strongest semiconductor device simulation workflows connect fabrication assumptions to electrical results. A process simulation can model implant profiles, diffusion, oxidation, etching, deposition, annealing, and stress. Its output becomes the physical geometry and doping distribution used by the device simulator.

This connection is particularly valuable when the difference between a successful and marginal part is measured in nanometers or in junction depth. A slightly different thermal budget can alter dopant activation, sheet resistance, threshold voltage, and breakdown behavior. Without process-aware simulation, an engineer may fit an electrical model to one lot while missing the physical source of lot-to-lot variation.

That said, process-to-device coupling is not required for every task. If the purpose is to compare contact layouts, estimate a sensor response, or study a known structure over temperature, a parameterized device geometry may be sufficient. The right level of detail depends on the decision being made. Early architecture work benefits from fast comparative runs; failure analysis and process development justify more detailed models.

Mesh Quality Determines Whether Results Can Be Trusted

A simulator divides the structure into a numerical mesh. The mesh must be fine enough where fields and carrier concentrations change rapidly, such as gate oxides, heterojunctions, depletion edges, sharp corners, and contact regions. A coarse mesh in these locations can suppress a field peak or shift a predicted breakdown voltage enough to create a false design margin.

Refining the entire structure indiscriminately is inefficient. It can multiply solution time and make convergence more difficult without improving the answer where it matters. Local refinement around critical junctions and interfaces is usually the better approach, followed by a mesh-convergence check. If a key result changes materially as the mesh is refined, the original solution was not yet dependable.

Convergence itself is a diagnostic. A failed nonlinear solution may indicate only a numerical issue, such as an aggressive voltage step or weak initial condition. It can also reveal an unrealistic structure, inconsistent material parameters, or a physical transition that needs a different model. Engineers should record solver settings and bias stepping with the same discipline used for device dimensions and doping values.

Calibrate Models Against Measurements

Simulation becomes engineering evidence only after calibration against relevant measurements. Start with quantities that constrain the physical model directly: layer thickness, dopant concentration, sheet resistance, contact resistance, and material composition. Then compare electrical data such as forward and reverse I-V curves, C-V characteristics, threshold voltage, transconductance, leakage, and temperature dependence.

One curve is rarely enough. A model can be tuned to match a room-temperature transfer curve while predicting the wrong capacitance or reverse leakage. Agreement across several independent measurements is stronger evidence that the physical assumptions are reasonable.

For component-level work, measurement quality sets the ceiling for calibration quality. Low-value capacitance, parasitic inductance, ESR, and fixture effects can distort extracted parameters. Direct, repeatable probing of loose SMD parts or populated boards helps separate a device property from the behavior introduced by leads, adapters, or a surrounding circuit. Instruments with appropriate test frequency, basic accuracy, and documented calibration are especially useful when model parameters are being adjusted from small signal data.

Siborg Systems supports this measurement-oriented workflow through compact LCR and component-test instruments designed for direct access to SMD and discrete parts. The measurement does not replace a device simulator, but it supplies the real-world data needed to challenge its assumptions.

Use Simulation to Ask Specific Design Questions

The most productive projects start with a question that has a measurable decision behind it. For a power MOSFET, the question may be whether a termination change improves breakdown voltage without excessive on-resistance. For a photodiode, it may be whether a depletion-region adjustment improves responsivity at the required bias while keeping capacitance low. For an LED, it may concern current crowding, thermal distribution, or wavelength sensitivity to layer composition.

A parameter sweep is useful when it is tied to those trade-offs. Vary gate length, oxide thickness, implant dose, contact spacing, temperature, or defect density over credible ranges. Then compare outputs that matter to the application rather than selecting the visually most attractive contour plot.

This approach also exposes compromises early. Lower resistance may require heavier doping that raises junction capacitance. A sharper field profile can improve one performance target while reducing reliability margin. Higher test current may make a signal easier to measure while introducing self-heating that masks the intended device behavior. Simulation is valuable because it makes these interactions visible before they become an expensive fabrication revision.

Semiconductor Device Simulation and Circuit Models

Device simulation and circuit simulation serve different jobs. A device solver explains behavior from geometry, materials, and physical transport. A circuit simulator predicts how a compact model behaves with surrounding components, supply transients, loads, and control loops.

The practical bridge is parameter extraction. Device-level results can be used to develop or refine compact-model parameters for circuit analysis, including threshold behavior, output characteristics, capacitances, and temperature coefficients. The compact model must retain the effects that matter at circuit level without becoming so complex that it is difficult to fit or unstable in simulation.

This distinction prevents a common error: expecting a circuit-level transistor model to reveal a localized electric-field failure mechanism, or expecting a detailed TCAD structure to efficiently simulate an entire power-conversion system. Use each tool at the scale where its assumptions are valid.

Common Sources of Misleading Results

The most convincing simulation plots can still be wrong. Material parameters may have been borrowed from literature that does not match the actual process. Interface trap density, contact behavior, and defect distributions are often uncertain but can dominate leakage, hysteresis, or low-current response. Boundary conditions and assumed thermal paths can also make a device appear cooler or more stable than a packaged part will be.

Variation deserves the same attention as nominal performance. A single simulation at nominal geometry and doping does not establish manufacturing capability. Run corners or statistical variations for the parameters most likely to move in fabrication. If a design only passes under one ideal profile, it has not yet earned its margin.

Results should also be checked for physical plausibility. Current continuity, charge balance, expected scaling trends, and agreement with known limiting cases provide fast reality checks. A result that looks precise because it has many decimal places is not necessarily accurate.

A well-built semiconductor device simulation shortens the path between a physical hypothesis and a measured answer. Treat it as a controlled engineering model, calibrate it with traceable data, and let discrepancies guide the next experiment. That discipline turns simulation from an attractive plot into a practical tool for better devices and faster design decisions.

Variable Current LED Tester for PCB Diagnosis

A failed backlight, indicator, or illumination string is rarely diagnosed well by simply asking whether an LED turns on. A variable current LED tester applies a known, adjustable current so the technician can observe forward voltage, brightness behavior, polarity, and consistency across devices. That controlled test condition matters when working with high-brightness LEDs, parallel paths, populated boards, and assemblies where excessive test current can create a misleading result or cause additional damage.

For PCB repair, production inspection, and field service, the useful question is not only whether an LED emits light. It is whether it behaves correctly at a current appropriate to its type and application. An adjustable-current test method provides a more defensible answer than a fixed-output continuity setting or an uncontrolled bench supply.

Why a Variable Current LED Tester Produces Better Results

An LED is a current-driven semiconductor. Its forward voltage changes with current and temperature, while perceived brightness does not increase linearly with electrical current. A test instrument that applies one fixed current may be adequate for a quick polarity check, but it can hide differences between a low-current signal LED and a high-power white LED.

Variable current lets the operator begin at a conservative level, confirm basic operation, and increase current only as required to produce a meaningful observation. This is particularly useful when the LED package is unknown, the circuit is partially populated, or the technician is probing a board where nearby components may affect the reading.

At a controlled current, forward-voltage comparison becomes more useful. LEDs of the same type and color should generally show similar forward voltage under the same test conditions. A large difference can indicate a damaged junction, an incorrect replacement part, an intermittent connection, or a device from a different bin or technology. It is not absolute proof of failure, since chemistry, temperature, and package construction all affect the result, but it is a strong diagnostic signal.

The method also protects the device under test. A small indicator LED may be harmed by a current intended for a power LED. Conversely, an extremely low test current can make a damaged high-power emitter appear normal because it has not reached the operating range where the fault becomes visible.

What to Measure Beyond Illumination

A useful LED test procedure combines visual inspection with electrical comparison. First, establish polarity and confirm that the device conducts in the expected direction. Then observe forward voltage at a stated test current. If the application contains multiple identical LEDs, compare each one under the same current setting rather than relying on an isolated value.

Brightness should be treated carefully. A visibly dim LED can be defective, but ambient light, viewing angle, phosphor condition, optics, and drive current can all affect what the eye sees. For white backlight LEDs, comparing devices side by side at the same current is more reliable than judging one device in isolation.

Intermittent faults require an additional step. Gently flexing the board, applying light mechanical pressure around solder joints, or warming the area slightly may reveal a connection that opens only under stress. In these cases, watch for changes in forward voltage or light output while maintaining a stable current. Do not raise current merely to force an intermittent device to fail visibly.

For LED strings, the tester must have sufficient voltage compliance to overcome the combined forward voltage of all LEDs in series. Current capability alone is not enough. A string of ten white LEDs may require approximately 25 V to 35 V or more, depending on operating current and device type. If the tester cannot supply the required voltage, a no-light result does not prove that the string is open.

Choosing Current for the Device Under Test

Current selection depends on LED construction and the objective of the test. For an unknown small LED, start at a low current. The goal is to confirm conduction and identify polarity without overstressing the junction. Increase only when needed to evaluate brightness or compare it against similar devices.

For high-brightness LEDs, a low-to-moderate current is often enough for diagnostic work. Full rated operating current is usually unnecessary and may introduce thermal effects that complicate the measurement. At higher current, junction heating lowers forward voltage, so readings taken after a few seconds may not match the initial value. Repeatable testing means using the same current, similar test duration, and similar ambient conditions for every comparison.

The appropriate test point also depends on whether the LED is loose or installed. A loose component can be evaluated directly, while an in-circuit LED may have parallel components, driver IC paths, ESD protection structures, or capacitor charging effects that alter the measurement. When a result is questionable, isolate one lead or compare the measurement with a known-good board.

Current Is Not a Substitute for Voltage Compliance

The distinction is operationally important. Test current determines how strongly the LED is driven. Voltage compliance determines whether the instrument can sustain that current through the device or series string. A variable current LED tester should state both specifications clearly.

If an instrument reaches its voltage limit before the selected current is achieved, the displayed condition reflects the limitation of the test setup, not necessarily the condition of the LEDs. Technicians troubleshooting television backlights, architectural lighting modules, or long display strings should verify maximum output voltage before selecting a tester.

In-Circuit Testing Requires Controlled Probing

A populated PCB introduces variables that are absent on a loose LED. A driver circuit may provide a return path that changes the reading. Other LEDs may be connected in series or parallel. Protection diodes can conduct before the intended LED does. For that reason, probe placement and test direction should be deliberate.

Begin with power removed and stored energy discharged. Verify that large capacitors in LED driver circuits are safe before touching the board. Then use insulated, stable probes that contact the LED pads or accessible test points without bridging adjacent SMD components. On fine-pitch boards, tweezer-style probes can improve contact control and reduce the time spent repositioning standard leads.

Record the current setting and measured forward voltage when comparing boards or building a repair record. This is especially useful in quality control, where a technician may need to distinguish normal process variation from a genuine assembly defect. A repeatable measurement record is more valuable than a visual pass/fail judgment alone.

Common Misreadings During LED Testing

An open reading can indicate an open LED, reversed probes, insufficient voltage compliance, a series break elsewhere in the circuit, or an in-circuit path that prevents a valid measurement. A low reading may reflect a shorted LED, but it can also be caused by parallel circuitry. The tester result must be interpreted in the context of the schematic and board layout.

Do not assume that all LEDs with the same package outline are electrically equivalent. A 3 V white LED, a 6 V dual-junction backlight LED, an infrared emitter, and a colored indicator may look similar while requiring very different test conditions. The device marking, board designators, service documentation, and comparison with a known-good component should guide the selected current.

Another frequent error is comparing forward voltage values gathered at different current levels. An LED measured at 1 mA cannot be meaningfully compared with one measured at 20 mA. The current setting, polarity, contact quality, and test duration must remain consistent.

Building a More Efficient LED Diagnostic Workflow

For routine work, establish a controlled sequence: inspect the assembly, remove power safely, start at low current, verify polarity, compare forward voltage, then evaluate brightness only as needed. If the part is installed, assess whether surrounding circuitry could influence the result before condemning the LED.

A variable-current approach is also useful alongside broader component measurement. After locating a suspected LED fault, technicians may need to verify driver resistors, current-sense resistors, capacitors, connectors, and solder joints. Specialized handheld instruments such as Siborg Systems’ PCB-focused measurement tools can reduce handling time when those supporting components are small surface-mount parts.

The best LED test is not the one that applies the most power. It is the one that applies enough controlled current and voltage to produce a repeatable result, while preserving the board and narrowing the fault quickly.

Bluetooth Multimeter Logging for Better Field Data

A meter reading that disappears when the probe moves is rarely enough to diagnose a field failure. Bluetooth multimeter logging converts individual readings into a time-stamped measurement record, giving technicians evidence of what a circuit did before, during, and after a fault condition. For troubleshooting intermittent power, verifying a repair, or documenting production checks, that record can be more valuable than a single value on the display.

What Bluetooth Multimeter Logging Actually Captures

Bluetooth logging sends measurements from a handheld meter to a phone, tablet, or PC application. Depending on the instrument and software, the record may include voltage, current, resistance, continuity state, frequency, temperature, timestamp, measurement range, and the selected function. The application can display a live trend, retain a table of readings, and export data for a service report or engineering review.

The practical benefit is not Bluetooth by itself. It is the ability to preserve changes that occur over time while keeping the meter at the measurement point. A technician can monitor a 24 V control supply while cycling a machine, observe battery voltage during a load event, or record resistance drift as a connector is flexed. The phone or PC becomes the display and record keeper, while the meter remains connected to the circuit.

This is particularly useful when the relevant event is brief. A meter may update its display fast enough to show that voltage changed, but not fast enough for the operator to read and write down the minimum value. Logging creates a record that can be reviewed after the event, compared against expected limits, and shared with the person responsible for the next diagnostic step.

Where Bluetooth Multimeter Logging Saves Time

Intermittent faults are the clearest use case. Consider a PCB assembly that resets only when a motor starts, a portable device that shuts down under transmit load, or a control cabinet that drops out once per shift. A single spot check may show normal voltage. A logged measurement can reveal a repeatable dip, its duration, and its relationship to the operating event.

Repair verification is another strong application. Before replacing a regulator, relay, harness, or battery pack, record the original behavior. After the repair, repeat the same test under the same load. The comparison is more defensible than a note stating that the circuit “appears normal.” For warranty work, maintenance records, and quality-control documentation, time-stamped data gives the repair a measurable baseline.

Production and incoming inspection teams can also use logging to standardize checks. Rather than having each operator transcribe readings manually, a defined procedure can capture the required measurements at a controlled interval. That does not eliminate the need for calibration, correct probe placement, or a documented test specification. It does reduce transcription errors and makes records easier to retrieve.

For PCB-level work, logging is most effective when paired with the correct measurement tool. A digital multimeter is appropriate for rail voltage, continuity, resistance, diode checks, and basic current measurements. When the task is identifying an unknown SMD capacitor, inductor, resistor, or ESR-related defect directly on a board, an LCR or ESR instrument provides measurement functions a conventional multimeter does not. The workflow should follow the component and failure mode, not the availability of a wireless connection.

Set the Logging Rate to Match the Fault

A common mistake is assuming that the fastest available logging interval is always best. It is not. Faster sampling produces more data, can consume mobile-device storage, and may not reflect the meter’s true measurement update rate. The usable rate depends on the meter’s conversion speed, the selected function and range, Bluetooth transmission behavior, and the application.

For slow changes, such as battery discharge, room-temperature drift, or a supply rail monitored over several hours, a one-second or longer interval may be sufficient. For a fault that occurs when a relay energizes or a device enters a high-load mode, use the fastest stable interval supported by the instrument and verify it with a known event.

There is also a boundary between logging and waveform capture. If the failure lasts microseconds or milliseconds, a digital multimeter log may show only an averaged value or miss the event entirely. An oscilloscope, data acquisition system, or instrument with an appropriate high-speed capture mode is then the correct tool. Some advanced portable test instruments combine multiple functions, but users should confirm the sampling and recording specifications for the mode being used.

Build a Measurement Record You Can Trust

A useful log begins before the first reading. Record the test point, circuit condition, expected value, meter function, range, and probe configuration. If measuring current, document where the meter is inserted and whether the circuit is operating normally with that series resistance. If using a temperature probe, identify its placement and attachment method.

The meter must also be suitable for the measurement. Basic accuracy, resolution, input impedance, burden voltage for current ranges, and safety category all affect the validity of a record. A highly detailed log cannot correct an inaccurate setup. For quality systems or regulated work, use an instrument with current calibration documentation, such as a NIST-traceable calibration certificate when required by the procedure.

Stability matters as well. Secure probes so that movement does not create false discontinuities or voltage spikes. For populated boards and fine-pitch work, dedicated probing accessories or tweezer-style instruments can improve repeatability by placing the measurement contact precisely where it is needed. On low-resistance circuits, consider lead resistance and contact resistance. On high-impedance nodes, consider probe loading and environmental contamination.

A short annotation at the right moment is often more useful than a larger data file. Mark events such as “motor start,” “heat applied,” “connector moved,” “battery load enabled,” or “firmware reset.” Without operating context, a trend graph can show a change but not explain why it occurred.

Bluetooth Connection Trade-Offs in the Field

Wireless logging adds convenience, but it introduces operating considerations. Bluetooth range varies with walls, metal enclosures, interference, and the orientation of the meter and mobile device. Keep the receiving device close enough to maintain a reliable connection, especially around industrial cabinets and equipment racks.

A dropped connection does not always mean the meter stopped measuring. It may mean the application stopped receiving data. Before relying on a logging setup for a long run, test how the instrument handles reconnection, whether measurements are buffered internally, and how gaps appear in exported data. A gap should be visible in the final record rather than silently replaced with estimated values.

Mobile devices require their own discipline. Disable aggressive battery-saving settings that may suspend the logging app, confirm that the device clock is correct, and protect the device from unauthorized access if measurement records include customer or production information. When the work is safety-critical, the technician still needs direct awareness of the live circuit. A remote screen is a convenience, not a substitute for safe procedures and proper personal protective equipment.

Turning Logs Into Diagnostic Evidence

After capture, review the data against the circuit’s expected behavior. Look for minimum and maximum values, rate of change, repeated patterns, and correlation with operator actions or load cycles. A 12 V rail that falls to 10.8 V may be acceptable in one design and unacceptable in another. The specification, not the graph alone, determines whether the result is a fault.

Compare like with like. Use the same test point, range, load condition, and logging interval when evaluating a repair against the original fault. If possible, capture a known-good unit under the same conditions. That reference often reveals whether the suspected anomaly is genuinely abnormal or simply normal operating variation.

For reports, retain the original data file and create a concise interpretation. State what was measured, when it was measured, what condition was applied, and what the data shows. A graph should support the finding, not replace it. For example: “The 5 V rail dropped below the controller’s minimum operating threshold for 1.6 seconds when the heater load engaged; replacement of the high-resistance supply connector eliminated the drop.”

Choose the Instrument Around the Work

Bluetooth capability should be evaluated alongside measurement performance. A logging function is only useful when the meter provides the required accuracy, ranges, functions, safety rating, and update behavior for the application. For electronics technicians, the decision may also include whether the job needs component-level LCR measurement, ESR testing, diode characterization, analog signature analysis, or oscilloscope capability in addition to standard DMM functions.

Siborg Systems designs compact test instruments for PCB and component work where direct access, repeatable measurement, and digital data capture matter. The right configuration depends on whether the primary task is tracking electrical behavior over time, identifying a component in circuit, or doing both as part of a structured repair process.

Start with one recurring diagnostic problem, define the event you need to capture, and test the logging setup before the next critical service call. A well-labeled record of a real fault is more useful than a folder full of readings with no operating context.

250 kHz LCR Meter for PCB Component Testing

A 250 kHz LCR meter is not simply a faster version of a standard bench LCR meter. Its value is that it tests components closer to the operating conditions where many small SMD parts, switching-power components, and high-frequency networks reveal their real behavior. For PCB repair, incoming inspection, and component verification, that additional test frequency can separate a plausible reading from a useful diagnosis.

A resistor that appears correct at a low test frequency may be easy to confirm with a multimeter. A small capacitor or inductor is different. Parasitic resistance, lead and fixture effects, dielectric behavior, and PCB coupling become increasingly significant as frequency rises. A meter capable of 250 kHz gives technicians and engineers another measurement point when a 1 kHz or 10 kHz result does not explain circuit performance.

Why 250 kHz Changes LCR Measurement

LCR instruments apply an AC test signal and calculate component parameters from the response. Depending on the selected measurement mode, the display may show inductance, capacitance, resistance, impedance, ESR, dissipation factor, or quality factor. The selected frequency matters because the device under test is not an ideal component.

At low frequencies, a capacitor may look primarily capacitive and an inductor primarily inductive. At higher frequencies, equivalent series resistance and parasitic inductance or capacitance influence the result. This is especially relevant for compact multilayer ceramic capacitors, small RF inductors, ferrite beads, chip coils, and components installed around switching regulators.

A 250 kHz test frequency is useful because it sits well above the frequencies offered by many general-purpose handheld meters. It can provide a more discriminating view of low-value components without requiring a full impedance analyzer for routine service work. It does not replace characterization across a broad frequency sweep, but it is an efficient frequency for finding parts that have drifted, become lossy, or no longer match neighboring devices.

The measurement is still application-dependent

Higher frequency is not automatically the correct setting. A large electrolytic capacitor may be specified or evaluated at 100 Hz, 120 Hz, or 1 kHz, while a precision film resistor may need a low-stress measurement setup to achieve its rated tolerance. The best test frequency depends on the component type, value, circuit function, and the specification being checked.

The practical advantage of a multi-frequency instrument is choice. A technician can compare readings at 1 kHz, 10 kHz, 100 kHz, and 250 kHz when the instrument supports those ranges, then determine whether the component behaves consistently or changes in a way that warrants closer investigation.

Where a 250 kHz LCR Meter Is Most Useful

Small inductors are one of the clearest use cases. In power-management circuits, inductors and ferrite components may pass a basic continuity check while their inductance, series resistance, or frequency response is no longer suitable for the converter. Measuring at 250 kHz can help expose a questionable part in circuits that switch in or near that region.

High-frequency ceramic capacitors are another strong candidate. Their effective capacitance changes with DC bias, temperature, package size, and frequency. An in-circuit reading must be interpreted carefully, but comparing matching capacitors in identical circuit locations can quickly identify an outlier. A 250 kHz reading can be more meaningful than a low-frequency capacitance value when the capacitor is part of a fast bypass, timing, or filtering network.

RF and communications boards also benefit from higher-frequency LCR testing. Chip inductors, small capacitors, and impedance-matching components are sensitive to placement and parasitics. A portable meter will not replace a vector network analyzer for RF design validation. It can, however, provide rapid component-level screening during assembly inspection, repair, and fault isolation.

For manufacturing and quality control, 250 kHz measurement supports comparison against approved samples. The goal is often not to fully model a component. It is to confirm that a reel, assembled board, or replacement part behaves within an expected range at a relevant test condition. Repeatable fixtures, a documented test frequency, and traceable calibration make those comparisons defensible.

In-Circuit Testing Requires Judgment

Testing a component on a populated board saves time, but the meter sees the whole network connected to the test points. Parallel paths can make resistance read low, nearby capacitors can increase apparent capacitance, and semiconductor junctions can affect the result. At 250 kHz, trace inductance and coupling between nearby circuit elements can add further error.

That does not make in-circuit testing ineffective. It changes the method. Use the reading to compare like-for-like locations, known-good boards, or components of the same design. If a value is questionable, isolate one terminal or remove the component before making a final disposition. This approach is faster than desoldering every suspected part and more reliable than accepting one isolated meter reading as proof.

Contact quality is equally important. Standard test leads are often too large and too unstable for 0402, 0201, and other small SMD packages. Spring-loaded tweezer probes provide direct access to both component terminals, reduce hand movement, and make it easier to repeat a measurement. Short test paths also reduce the fixture inductance and capacitance that become more relevant at high frequency.

Before measuring low impedance or small capacitance, perform open and short compensation using the intended probes or tweezers. Compensation removes a portion of the fixture contribution, but it cannot correct poor contact, dirty terminals, or a component surrounded by an active circuit network. Keep the board unpowered and discharge capacitors before connecting the meter.

Specifications That Matter Beyond 250 kHz

Test frequency is only one part of instrument selection. Basic accuracy determines how closely a reading can approach the actual value under stated conditions. For component sorting, production inspection, and engineering records, 0.1% or 0.2% basic accuracy may matter as much as the frequency range. Review accuracy at the range and test frequency you intend to use, rather than relying on a single headline specification.

Resolution also deserves attention. A meter may support 250 kHz yet not provide enough stable resolution for the low-value capacitor or inductor being tested. Look at the minimum measurable value, display digits, measurement speed, and the behavior of the auto-ranging system. A fast reading is useful only if it settles consistently.

Measurement modes should match the work. Series and parallel equivalent models are not interchangeable. Series mode is generally appropriate when ESR is a significant part of the component behavior, while parallel mode is often useful for high-impedance components. The correct choice depends on the component and test conditions. An instrument that clearly provides L, C, R, ESR, D, Q, and impedance data gives the operator more context than one that displays a single nominal value.

Calibration documentation matters in professional environments. A NIST Traceable Calibration Certificate supports quality-system requirements and gives confidence that the meter has been checked against recognized standards. Field users should also consider probe wear, battery condition, mechanical durability, and whether calibration intervals fit their operating procedures.

Handheld Tweezers Versus Conventional Fixtures

Conventional LCR meters with test leads and Kelvin fixtures remain appropriate for many lab measurements. They can offer controlled connections and are well suited to larger through-hole components or dedicated production fixtures. Their limitation is speed when the work involves dense boards and tiny parts.

Tweezer-style LCR meters address that workflow directly. The probe and measurement interface are combined, allowing the user to grip an SMD component, read the value, and move to the next location with minimal setup. For repair benches, rework stations, and incoming inspection, this can reduce handling time substantially.

Siborg Systems instruments such as the Smart Tweezers and LCR-Reader families combine this direct-contact approach with high-frequency measurement options, including models rated to 250 kHz. Advanced configurations may also add Bluetooth data transfer, oscilloscope functions, or Analog Signature Analysis for technicians who need more than an LCR value during board-level troubleshooting.

A Practical 250 kHz Measurement Workflow

Start by identifying what the component should do in the circuit. A 10 nF bypass capacitor, a 2.2 µH converter inductor, and a ferrite bead should not be evaluated using the same expectation or parameter. Select the closest relevant frequency, then compare the result against the component datasheet, a known-good board, or an identical location.

Use short, clean probes and compensate the instrument before testing. Make contact squarely on the component terminals without pressing hard enough to damage a small package or lift a weak pad. If readings shift significantly when the probes move, improve contact before judging the component.

When a reading is surprising, check it at more than one frequency. A stable component usually changes in a pattern that makes electrical sense. A reading that is unstable, inconsistent with adjacent matching parts, or dramatically different at 250 kHz may indicate damage, a parallel circuit path, or an unsuitable in-circuit test condition. Isolate the part only when the evidence justifies the extra rework.

The most productive use of a 250 kHz LCR meter is not to measure every component at the highest available frequency. It is to apply the frequency where it adds diagnostic separation, document repeatable results, and turn a compact measurement into a confident repair or inspection decision.

SMD Test Tweezers for Faster PCB Diagnosis

A 0402 capacitor can stop a board from starting, yet it is often the hardest part to test with ordinary meter leads. SMD test tweezers address that access problem directly: two fine, insulated probes hold the component terminals while the instrument identifies and measures the part. For PCB repair, production inspection, and prototype debugging, that changes component testing from a slow lead-placement task into a controlled two-point measurement.

What SMD Test Tweezers Measure

SMD test tweezers are handheld LCR instruments built around tweezer-shaped probes. The tips contact opposite ends of a surface-mount component, and the instrument applies an AC or DC test signal to determine electrical behavior. Depending on the model and selected mode, the result may include resistance, capacitance, inductance, impedance, ESR, DC voltage, diode characteristics, continuity, or frequency.

Their main advantage is not simply compact size. It is direct access. Standard multimeter probes can be too large for 0603, 0402, and smaller packages, and their flexible leads introduce movement that makes repeated contact difficult. Fine tweezers let the operator approach the component from above, stabilize both contacts at once, and read a result without a separate fixture.

For resistors, automatic identification is usually fast and straightforward. Capacitors and inductors require more consideration because measured values depend on test frequency, device losses, and the surrounding circuit. A professional LCR tweezer should therefore provide appropriate frequency options, stable test conditions, and accuracy specifications that are meaningful at the values being measured.

Why Test Frequency Matters on Small Components

An SMD component does not behave identically at every frequency. This is particularly relevant when testing capacitors, inductors, ferrites, and low-resistance components used in switching power supplies, RF sections, and high-speed digital designs.

A capacitor measured at a low test frequency may show a value that is acceptable for general verification but less representative of its intended operating behavior. Likewise, an inductor or ferrite bead evaluated only at a low frequency can conceal the impedance characteristics that matter in its application. Instruments with 100 kHz or 250 kHz test frequencies provide a more useful measurement range for many modern components than basic low-frequency meters.

Frequency alone does not guarantee a correct diagnosis. The selected frequency must match the measurement objective. A technician checking whether a bypass capacitor is shorted may need a quick in-circuit capacitance or resistance comparison. An engineer qualifying a small inductor for a design may need inductance, impedance, Q, or dissipation factor at a specified frequency. The appropriate tool and settings depend on the question being asked.

In-Circuit Measurement Requires Judgment

The convenience of SMD test tweezers is most apparent on populated boards, but in-circuit readings must be interpreted carefully. Parallel paths, semiconductor junctions, adjacent capacitors, and IC inputs can influence the result. A component that reads incorrectly in circuit is not automatically defective.

A low-value resistor may appear lower because of a parallel resistor or copper path. A capacitor can read higher than expected when other capacitors share the same power rail. A diode measurement can be affected by protection networks and connected transistor junctions. These effects are normal consequences of measuring a component that remains connected to a larger circuit.

The most effective approach is comparative. Measure the suspected component, then compare it with the same reference location on a known-good board or with similar components in the same circuit section. Check readings in both probe orientations when semiconductors are involved. If the in-circuit result remains ambiguous, lift one terminal or remove the component for confirmation.

This workflow avoids unnecessary rework. Removing a small multilayer ceramic capacitor or fine-pitch resistor before establishing evidence can damage pads, disturb neighboring parts, and consume more time than the original fault warrants.

Selecting SMD Test Tweezers for the Job

The right instrument depends on component types, required accuracy, and whether measurements must be documented. Basic models can be effective for general resistor, capacitor, and diode checking. Repair labs and engineering groups working on tighter tolerances should evaluate basic accuracy, available test frequencies, repeatability, calibration support, and probe-tip options.

For example, 0.1% or 0.2% basic accuracy has practical value when sorting precision resistors, verifying low-tolerance components, or comparing changes across a production run. It is less decisive when locating a clearly shorted 10 uF rail capacitor. Accuracy should be evaluated alongside resolution, measurement range, and performance at the actual impedance and frequency of interest.

Probe geometry also matters. Fine gold-plated tips can access dense layouts, but tips that are too sharp may slip between pads or mark soft component terminations if used carelessly. Replaceable tips are useful in service environments where repeated contact eventually causes wear. Proper insulation near the tips reduces the risk of bridging adjacent pads, especially around fine-pitch ICs and tightly packed passives.

Calibration is another differentiator for professional use. A NIST-traceable calibration certificate supports quality systems, incoming inspection requirements, and documented measurement practices. For an occasional bench tool, that may not be a purchasing priority. For a production, service, or quality-control environment, it can be essential.

A Practical PCB Troubleshooting Sequence

Start with power removed unless the measurement specifically requires a live circuit. Inspect the board first for cracked capacitors, overheated resistors, corrosion, solder bridges, and missing components. Visual inspection often identifies the area that deserves measurement before any instrument is applied.

Next, verify the obvious faults. Use resistance or continuity measurements to locate shorted power rails, then compare capacitors along the affected rail. A very low reading on one capacitor relative to nearby parts may identify the likely fault location. When checking resistors, compare the displayed value with the marking, schematic, bill of materials, or a matching channel on the board.

For a suspected diode, LED, or transistor junction, use the instrument’s appropriate semiconductor test function and reverse probe orientation where applicable. A forward drop, open reading, or low resistance in both directions can provide useful evidence, but circuit context still matters. Connected IC pins and protection diodes may produce readings that resemble a component fault.

Finally, record results when the work requires traceability. Bluetooth-enabled models can improve this part of the workflow by transferring readings to a mobile device or PC rather than relying on handwritten notes. That is particularly useful during recurring repair, incoming inspection, failure analysis, or when an engineer needs to share measured data with a remote team.

Beyond Basic LCR Measurements

Some faults cannot be confirmed by a single capacitance or resistance value. Intermittent behavior, damaged semiconductor structures, and partially failed passive parts may require a broader view of the circuit. Advanced handheld instruments can combine LCR measurement with oscilloscope capability or Analog Signature Analysis to help identify abnormal component behavior.

Analog Signature Analysis is valuable when comparing an unpowered suspect circuit against a known-good section or board. Instead of relying only on a numeric reading, the technician examines the voltage-current signature created by the test signal. A changed curve can reveal a leakage path, open junction, or altered component behavior that a basic meter reading may not make obvious.

That capability does not replace conventional measurements. It complements them. Numeric LCR results are efficient for identifying nominal values and verifying tolerances, while signature-based comparison can help when the circuit connection makes a simple in-circuit result uncertain.

Getting Repeatable Readings

Good technique has a direct effect on measurement stability. Clean the probe tips, hold the instrument so both tips contact the terminal surfaces rather than solder-mask edges, and avoid pressing hard enough to move the component. Allow the reading to settle before recording it, especially when measuring higher-value capacitors or inductive parts.

Zeroing or calibration compensation should be performed according to the instrument procedure, particularly after changing tips. Keep the tips clean and aligned, and use an appropriate accessory or external probes when the component location cannot be safely reached with the integrated tweezers. A compact instrument is only as effective as the contact it makes.

Siborg Systems Smart Tweezers and LCR-Reader instruments are designed around this direct-contact workflow, with configurations ranging from portable component identification to advanced high-frequency and Bluetooth-enabled measurement. The practical value is simple: less time fighting probe placement, more time determining what the component and circuit are actually doing.

When a board fault comes down to one part among hundreds, the best measurement tool is the one that gives you stable contact, relevant test conditions, and enough confidence to make the next repair decision without removing components prematurely.

Analog Signature Analysis for PCB Faults

A board can look intact, pass a basic continuity check, and still fail because one semiconductor junction is leaky, one IC pin is shorted, or one parallel path no longer behaves like the reference circuit. Analog signature analysis gives technicians a practical way to see those differences before applying power. Rather than reporting a single resistance, capacitance, or diode-drop value, it displays the voltage-current relationship of a circuit node as a recognizable trace.

For PCB repair, production troubleshooting, and incoming inspection, that visual comparison can reduce the time spent isolating faults hidden by parallel components and complex semiconductor networks. It is especially useful when a known-good board, matching channel, or repeated circuit section is available for comparison.

What Analog Signature Analysis Measures

Analog signature analysis, often called ASA or VI signature analysis, applies a controlled AC stimulus between a probe point and circuit common on an unpowered board. The instrument observes the resulting voltage and current, then plots them against one another. The displayed pattern is the component or network signature.

A purely resistive path produces a straight diagonal line. A capacitor produces an elliptical trace because current leads voltage. Inductance changes the ellipse in the opposite direction. Diodes and transistor junctions create nonlinear shapes with knees, arcs, or asymmetric halves. A complex IC pin may produce a signature that is not easily assigned to a single textbook component, but it can still be highly repeatable on a healthy board.

That distinction matters. ASA is not intended to replace an LCR measurement, ESR test, oscilloscope capture, or powered functional test. It is a comparative diagnostic method. Its strength is showing that a node behaves differently from its expected electrical signature.

Why One Reading Is Often Not Enough

A digital multimeter is indispensable, but its resistance and diode-test modes usually provide one operating point. An LCR meter measures selected component parameters at defined test conditions. Both results are valuable, yet neither necessarily shows how a populated circuit path responds across a changing applied voltage.

Consider an IC input protected by clamp diodes. A meter may report a plausible diode value in one direction and overload in the other. ASA can reveal whether the expected clamp action occurs symmetrically, whether a junction begins conducting too early, or whether a leakage path has altered the shape. The comparison becomes more useful when the same point is measured on a working board.

The method also helps where in-circuit measurements are ambiguous. A resistor in parallel with other components may not measure near its marked value. A capacitor may be connected to semiconductor junctions, power rails, and neighboring circuitry. Instead of treating every nonstandard reading as a bad part, compare the complete node signature to a known-good equivalent. If the traces agree, the network is probably behaving as designed.

How to Use Analog Signature Analysis on a PCB

Start with power removed and stored energy discharged. This is a low-energy diagnostic method, not a powered-circuit test. Remove batteries, disconnect external supplies, and discharge large capacitors according to the equipment procedure. Verify the board is safe to probe before connecting an ASA instrument.

Choose a stable reference point, usually circuit ground, and probe the suspect node. For a first pass, use a test level that provides readable traces without forcing conduction through circuitry that does not normally see that stress. Test amplitude, source resistance, and frequency influence the displayed signature, so comparison measurements must use identical settings.

The most productive approach is comparison probing. Measure the same node on a known-good board, an identical board section, or a repeated channel. Differential amplifier stages, LED driver channels, multi-phase power sections, and replicated I/O circuits are well suited to this process. A mismatch in shape, tilt, symmetry, or trace width is a reason to investigate further, not automatic proof that the nearest component has failed.

When no reference board exists, compare related nodes and use the schematic or board layout to understand what is connected. This takes more interpretation. A signature that looks abnormal in isolation may be correct for a node tied to protection devices, pull-up networks, or internal IC structures.

Read the Shape Before Naming the Fault

A trace collapsed near the vertical axis suggests a low-impedance path or short. A trace close to the horizontal axis suggests a high-impedance or open condition, although the selected range and source impedance must be considered. A shifted or widened ellipse can indicate changed capacitance, ESR, leakage, or an additional parallel path.

Asymmetry is often the most revealing clue. If one half of a trace differs from the other, look for a diode, transistor junction, MOSFET body diode, TVS device, or IC input-protection structure. If the healthy reference has a clean knee and the suspect board has a rounded, early-conducting curve, leakage or junction damage becomes plausible.

Do not interpret a signature without considering the circuit around it. A shorted ceramic capacitor may create a near-vertical trace, but so can an intentionally low-value resistor or a power rail with many parallel loads. An apparently open node may be isolated by a switch, relay, or logic state that is normal when the board is unpowered.

Selecting Test Conditions Matters

ASA results are only as comparable as the conditions used to create them. Increasing stimulus voltage can turn on semiconductor junctions that remain invisible at lower levels. Changing source resistance limits current differently and can alter the slope or knee of a trace. Test frequency changes the response of capacitive and inductive paths.

This is not a weakness. Adjustable conditions let an experienced user expose faults that a single fixed test cannot reveal. The trade-off is discipline: record the settings used for a good-board signature, then duplicate them precisely on the suspect board. A library of reference captures becomes substantially more useful when it includes board revision, probe location, ground point, and test conditions.

For small surface-mount work, probe control is equally important. Fine probes or tweezer-style contacts help prevent slipping onto adjacent pads and reduce hand-induced variation. On dense assemblies, use a fixed ground clip and approach test pads or component ends consistently. Repeatability is part of the measurement. Where ASA Fits With LCR, ESR, and Oscilloscope Tools

A practical bench workflow uses each instrument for what it does best. Use a high-accuracy LCR meter or the multi-function LCR-Reader-Pro to identify resistance, capacitance, inductance, impedance, and ESR. Use an ESR meter when electrolytic capacitor condition is the question. Use a DMM for voltage, continuity, diode checks, and general verification. Use an oscilloscope on powered equipment to examine timing, ripple, noise, and switching behavior.

Use analog signature analysis when the board is unpowered and the fault is likely hidden in a network, semiconductor path, or unknown in-circuit interaction. It can narrow a large search area before powered testing, which is valuable when powering a damaged board could worsen a fault or obscure it through protection shutdown.

Advanced handheld instruments like the LCR-Reader-MPB, which combines high-accuracy LCR/ESR measurement, LED testing, oscilloscope modes, and built-in Analog Signature Analysis (ASA), reduce tool changes at the bench. Pair it with software integration or the LCR-Reader Smart LED Tester & ASA Module for extended visual signature capturing. Siborg Systems instruments are designed around this type of direct PCB access, pairing compact probing with measurement functions suited to discrete and surface-mount components. The right configuration still depends on required test frequency, basic accuracy, data capture needs, and the types of boards serviced.

Common Mistakes That Produce Misleading Signatures

The most common error is comparing unlike conditions. A different ground point, probe location, test range, or stimulus setting can create a visible difference even when both boards are good. Document the setup before drawing conclusions.

Another mistake is assuming every trace belongs to one component. On a populated board, the signature is usually the combined response of everything electrically connected to that node. Use board knowledge and comparison points to separate a true anomaly from normal circuit topology.

Finally, avoid probing powered circuits in ASA mode unless the instrument documentation explicitly permits it. External voltage can damage the instrument, distort the signature, or create a safety hazard. ASA is most effective as a controlled, unpowered test.

A useful signature does not have to identify the failed part immediately. Its job is to tell you where electrical behavior stopped matching the expected circuit. From there, targeted LCR, ESR, diode, continuity, and powered tests can turn a suspicious trace into a confirmed repair.

.

PCB Troubleshooting That Finds Real Faults

A board that will not power up rarely announces whether the fault is a shorted capacitor, a damaged regulator, a cracked solder joint, or an incorrect enable signal. Effective PCB troubleshooting starts by reducing that uncertainty in a controlled sequence. The objective is not to measure every component. It is to establish what changed, identify the affected circuit domain, and make measurements that separate likely causes from unlikely ones.

For densely populated boards, test access and measurement conditions matter as much as meter resolution. A resistance reading taken across an energized rail, a capacitance reading made through parallel components, or a diode-test result influenced by a semiconductor junction can send the investigation in the wrong direction. Treat every result as evidence within the circuit, not as an isolated component specification.

Start PCB Troubleshooting With the Fault Condition

Before probing, document the board condition. Record the reported symptom, supply voltage, current consumption, operating temperature, recent repair history, and whether the fault is repeatable. A board that fails only after warm-up requires a different approach than one that immediately draws excessive current at the input.

Then divide the problem into a functional boundary. Is the input supply absent? Is a regulated rail missing? Does a processor rail come up but reset continuously? Is a communication interface active while an analog channel is incorrect? This first division prevents random probing across unrelated sections of the PCB.

A visual inspection is still efficient when it is specific. Look for displaced 0201 and 0402 parts, tombstoned passives, fractured MLCC capacitors, lifted pads, solder bridges beneath fine-pitch packages, discolored areas, contaminated connectors, and incomplete rework. Under magnification, inspect component orientation and reference designators against the assembly documentation. A misplaced resistor network or reversed diode can produce measurements that appear to indicate a silicon failure.

With power removed and capacitors discharged, check the resistance from each supply rail to ground. Compare the result with a known-good board when one is available. Absolute resistance alone is not a universal pass or fail criterion. A modern processor core rail may have a naturally low resistance, while a 12 V auxiliary rail should not. The important question is whether the reading is consistent with the design and with equivalent boards.

Use Power Intelligently, Not Aggressively

When the resistance check suggests a possible short, do not immediately apply the full system supply. Use a current-limited bench supply at a controlled voltage appropriate for the rail under test. Monitor both voltage and current as the limit is raised. A rail that should consume milliamps but reaches the current limit at a few hundred millivolts needs localization before normal power is restored.

Controlled injection can reveal a dissipating device through thermal imaging, freeze spray, or careful temperature sensing. It also has limits. Excess voltage can forward-bias protection structures, damage low-voltage ICs, or create misleading heat in a component that is not the original fault. Inject only into a confirmed rail, understand what else is connected to it, and begin below its nominal voltage.

If the board powers but behaves incorrectly, measure the rail at the load rather than only at the regulator output. A rail can look correct at the source while a cracked via, failed ferrite bead, or high-resistance connector leaves an IC undervoltage at its pins. Check DC level, startup behavior, ripple, and transient drop under the actual load. Oscilloscope measurements are especially useful for reset lines, enable signals, switch-node activity, clock presence, and rail sequencing.

Select the Measurement Mode That Answers the Question

A digital multimeter is often the right first instrument for continuity, DC voltage, diode behavior, and gross resistance faults. It is less decisive when the suspected defect involves capacitance loss, equivalent series resistance, inductance, or a small passive component in a crowded assembly.

For component-level work, an LCR measurement provides information that resistance alone cannot. A capacitor may not be shorted or open, yet its capacitance can be far below value or its ESR can be high enough to destabilize a converter. An inductor can retain continuity while its inductance or DC resistance no longer supports the intended filter or power stage. A resistor can be nominal at room temperature but reveal an intermittent open when flexed or heated.

Test frequency is part of the result. A capacitance or impedance measurement at 1 kHz does not necessarily predict behavior in a 100 kHz switching supply or a higher-frequency signal path. Likewise, in-circuit results can be influenced by parallel capacitors, semiconductor paths, and surrounding bias networks. Measure the part in circuit when the reading clearly identifies a fault, but lift one end or compare against a known-good assembly when circuit interaction creates ambiguity.

SMD test tweezers reduce a common source of error: probe placement. Direct two-terminal contact helps avoid slipping onto adjacent pads and allows technicians to characterize small resistors, capacitors, inductors, and diodes without removing them first. Instruments such as Siborg Smart Tweezers can combine component identification with LCR measurement directly at the board, which is useful when high-density assemblies make conventional probes slow to position accurately.

Use Analog Signature Analysis for Troubleshooting Unpowered PCBs

Analog Signature Analysis Provides Safe Troubleshooting on Unpowered PCBs A board that fails to boot or exhibits erratic signaling does not always reveal its root cause through static resistance or continuity checks alone. When schematic documentation is unavailable or high-density surface-mount devices (SMDs) make probing difficult, Analog Signature Analysis (ASA)—also known as V/I curve tracing—delivers a controlled diagnostic pathway without risk to sensitive components.

ASA works by applying a current-limited AC test voltage across an unpowered component or circuit node and plotting the resulting voltage against current on a visual trace. Because every passive component, semiconductor junction, and complex IC produces a unique impedance signature, technicians can evaluate component health, detect junction degradation, and pinpoint shorted MLCCs or open vias directly in-circuit.

Because tests are conducted entirely on unpowered boards, ASA eliminates the danger of thermal damage or short-circuit propagation that can occur when applying live power to a damaged rail.

Implement Signature Analysis and Advanced Testing in Field Environments Historically, signature analysis required dedicated benchtop curve tracers or specialized oscilloscope instruments. Modern handheld tools streamline this process by combining LCR measurement, signal generation, and oscilloscope modes directly into two-terminal tweezer probes designed for tight board geometry.

Evaluating components in-circuit requires understanding how parallel paths alter the observed signal. For high-reliability applications across aerospace, military, and industrial maintenance, instruments from the LCR-Reader product line integrate auto-ranging LCR measurements with user-selectable test frequencies. This allows technicians to distinguish between pure capacitive reactance and complex parallel resistance in crowded circuit sections.

Where precision metrology and signal analysis are required in field environments, the LCR-Reader-MPB All-in-One Multimeter provides sub-picofarad resolution (validated down to 0.1 pF), integrated oscilloscope waveforms, and continuous signal generation. By verifying both component parameters and AC response characteristics at the board level, test engineers can validate complex analog nodes and confirm circuit repairs before applying full operational power.

Interpret Common Failure Signatures Carefully

Certain measurement patterns narrow the search quickly, provided they are interpreted in context:

  • A near-zero resistance rail with abnormal injected current often points to a shorted MLCC, protection diode, MOSFET, or failed IC.
  • A valid regulator input with no output may indicate an open fuse, failed regulator, missing enable signal, overloaded output, or incorrect feedback path.
  • A rail that rises and falls periodically commonly suggests current limiting, undervoltage lockout, thermal shutdown, or an unstable control loop.
  • An intermittent fault that responds to pressure, heat, or board flex often involves solder joints, vias, connectors, BGA interconnects, or cracked components.

Do not assume the warmest part is the defective part. A shorted downstream capacitor may cause the regulator or ferrite bead to heat first. Similarly, an IC that measures as a diode junction in one direction may be normal. Compare polarities, compare neighboring channels, and consult the schematic before condemning a device.

Work From the Circuit Function Back to the Part

The most efficient troubleshooting follows signal and power flow. For a nonfunctional switching regulator, verify input voltage, enable state, output short condition, feedback voltage, switching waveform, inductor continuity, and output-capacitor condition. For a failed digital interface, confirm supply rails and reset before investigating level shifters, termination, clocks, or protocol activity.

This sequence matters because a component can test correctly outside its operating environment but still be involved in the failure. A MOSFET may pass a static diode test while its gate drive is absent. A ceramic capacitor may measure close to nominal capacitance but become problematic under DC bias. A connector may show continuity at rest and open under vibration. Static measurements and powered observations should support each other.

Where a board has repeated channels, use them as controlled references. Compare resistance to ground, diode-mode values, passive-component measurements, rail ripple, and waveform timing between the working and failed channels. This is often faster than relying on a nominal value from a silkscreen or bill of materials because it accounts for the actual design and installed component tolerances.

Confirm the Repair Before Releasing the Board

Replacing the first suspicious part is not the end of the process. Inspect the rework area for pad damage, solder bridges, incorrect orientation, and disturbed neighboring components. Repeat the original unpowered measurements, then power the board with current limiting before applying its normal source.

Confirm that the original symptom is gone under realistic conditions. Run the board through startup, load, temperature, communication, and any functional test relevant to its application. Record the failed part, measured fault signature, repair action, and final verification values. That record improves future diagnosis, particularly for recurring field failures or production escapes.

The fastest path to a reliable repair is usually not more probing. It is a disciplined measurement sequence, matched to the circuit function, followed by verification that the board now behaves correctly at the conditions where it previously failed.

ESR Meter Readings That Find Bad Capacitors

A capacitor can measure close to its rated capacitance and still be the reason a power supply oscillates, a control board resets, or an audio circuit develops noise. An ESR meter identifies this failure mode by measuring equivalent series resistance, the small resistive loss present inside every real capacitor. When that loss rises beyond an acceptable level, the capacitor may no longer filter ripple current or deliver transient current effectively.

For PCB repair, production troubleshooting, and incoming inspection, ESR measurement is often faster than removing a suspect capacitor and checking capacitance alone. The reading must still be interpreted in context: capacitor type, value, voltage rating, temperature, test frequency, and circuit connections all affect the result.

What an ESR Meter Actually Measures

An ideal capacitor has only capacitance. A physical capacitor also has resistance from its foil, electrolyte, terminals, internal connections, and dielectric losses. Equivalent series resistance, or ESR, represents those losses as a resistance in series with the capacitor.

At low ESR, a capacitor can pass ripple current with limited heat generation and maintain its filtering performance. At high ESR, ripple current produces more voltage drop and internal heating. In switching regulators, this can increase output ripple, destabilize a feedback loop, or cause intermittent startup faults. In older linear power supplies, high ESR electrolytics can lead to hum, poor regulation, and reduced load capability.

An ESR meter applies a small AC test signal and calculates the resistive portion of the component’s impedance. This is different from a DC resistance measurement. A digital multimeter’s ohms range is useful for finding a shorted capacitor or observing a basic charging response, but it does not provide a valid ESR value.

Capacitance and ESR should be treated as complementary measurements. A capacitor can lose capacitance, develop high ESR, become leaky, or fail short. No single test catches every condition.

Why Test Frequency Changes the Reading

ESR is frequency-dependent. Capacitors used in switching power supplies are often specified at frequencies such as 100 kHz, because that operating range better reflects the currents they handle. A measurement made at a much lower frequency can be useful, but it may not correlate closely with the manufacturer’s impedance or ESR specification.

This is why test frequency is a practical selection criterion, not a brochure detail. A meter operating at 100 kHz such as LCR-Reader line of devices is generally well suited to evaluating low-ESR capacitors in switching circuits. Higher-frequency measurement capability can provide additional visibility when testing modern compact components and investigating behavior closer to their operating conditions.

Frequency is not the only variable. Temperature matters as well. Electrolytic capacitor ESR usually rises substantially at low temperature, while a part tested immediately after power has been removed may read differently from the same part at room temperature. Compare readings under similar conditions whenever repeatability matters.

Reading ESR Values Without Chasing One Universal Limit

There is no universal pass/fail ESR number for all capacitors. A 1,000 µF low-ESR polymer capacitor may be expected to measure only a few milliohms, while a small general-purpose electrolytic capacitor may normally measure several ohms. Judging both against the same threshold produces false failures and missed defects.

Start with the component’s datasheet when it is available. Look for impedance, dissipation factor, or ESR specified at a stated frequency and temperature. If the installed part is from an unknown source, compare it with a known-good board, an identical replacement part, or a component from the same circuit position.

The most useful field diagnosis is often comparative. If several output capacitors on a supply rail are identical and one reads materially higher than the others, it deserves attention even when its capacitance appears acceptable. Likewise, an ESR value that changes significantly after gently flexing a lead or touching a connection may point to a poor solder joint rather than a failed capacitor.

Be cautious with very low values. Lead resistance, probe contact resistance, oxide on terminals, and measurement fixture quality can dominate a milliohm-level reading. Zeroing or compensating the probes before measurement is essential when the instrument supports it.

In-Circuit ESR Testing: Fast, but Not Automatic

In-circuit testing is one of the main reasons technicians use an ESR meter. It can reduce disassembly time and quickly narrow a fault to a group of capacitors. However, the circuit around the capacitor can influence the result.

Parallel capacitors lower the apparent ESR. Inductors, transformers, low-resistance semiconductor paths, and other connected components can create alternate paths for the test signal. A low in-circuit ESR reading does not always prove that the selected capacitor is healthy. A high reading is often more actionable, provided the probes have solid contact and the board is unpowered.

Before probing, disconnect all power sources and discharge the capacitor safely. Do not assume a board is discharged because its indicator LED is off. High-voltage capacitors in offline power supplies require controlled discharge procedures and suitable safety practices.

For ambiguous readings, isolate one lead or remove the part. This takes longer, but it separates the capacitor from parallel circuitry and provides a defensible measurement. In production or quality-control work, the same principle applies: define whether the inspection process is measuring the individual component or the assembled circuit behavior.

What to Look for in an ESR Meter

An ESR meter should be selected for the components and failure modes you actually encounter. Basic accuracy matters because a small difference in ESR can distinguish a normal low-loss capacitor from a marginal part. Resolution also matters, especially for low-ESR aluminum electrolytic and polymer capacitors used on modern power rails.

For board-level work, probe geometry is equally important. Conventional clip leads can be slow on dense PCBs and may contact adjacent pads or components. Fine probes, Kelvin-style connections where appropriate, and tweezer-form instruments improve access to small surface-mount capacitors and reduce handling time.

Consider these operating requirements together:

  • Test frequency appropriate for switching-power and general electronics work
  • ESR range and resolution that cover milliohm through multi-ohm measurements
  • Stable probe compensation and low-resistance contact capability
  • Clear indication of measurement mode, range, and battery condition
  • Calibration support when measurements affect service records, quality documentation, or customer acceptance

A combined handheld LCR instrument can be more efficient than a dedicated ESR-only device when troubleshooting includes capacitance, inductance, resistance, and component identification. The trade-off is workflow: a dedicated ESR function may be the quickest path when capacitor faults are the primary concern, while an LCR meter provides broader diagnostic coverage on mixed-component assemblies.

Professional instruments such as Siborg’s handheld LCR and Smart Tweezers configurations are designed around direct component access, with test-frequency options, compact probing, and calibration-supported measurement for PCB work.

A Repeatable ESR Test Procedure

A reliable result begins before the probes touch the board. Confirm the equipment is off, disconnect battery packs or external supplies, and discharge stored energy. Inspect the capacitor and surrounding area for leakage, venting, lifted pads, heat discoloration, or damaged solder joints. Visual damage is not required for ESR failure, but it can direct the investigation.

Set the correct ESR or LCR measurement mode, select the intended test frequency if the instrument allows it, and compensate the probes according to the meter’s procedure. Keep probe pressure consistent. On small SMD capacitors, contact resistance can change dramatically if one tip lands on solder mask, a contaminated pad, or the edge of a termination.

Record the measured value, the capacitor’s marked value and type, the test frequency, and whether the part was measured in circuit. This record turns a one-time reading into useful diagnostic data. It also makes recurring failures easier to identify across repair lots or production boards.

When a reading is questionable, compare it with a known-good reference before replacing parts. Replacing every capacitor that looks old is sometimes justified in aging equipment, but it is not a substitute for measurement. A targeted ESR test reduces unnecessary rework and helps preserve original components that remain within specification.

Common Misinterpretations to Avoid

A low ESR reading is not always good. A capacitor that has failed short may show very low resistance or may be masked by a parallel path on the board. Check for abnormal DC resistance, excessive current draw, and rail-to-ground shorts where appropriate.

A high reading is not always a failed capacitor. Poor probe contact, corroded terminals, cracked solder joints, and insufficient probe compensation can all add apparent resistance. Confirm the connection before condemning the component.

Finally, do not compare an ESR reading taken at one frequency with a datasheet value specified at another frequency without qualification. The measurement may still reveal a relative fault, but it is not a direct specification comparison.

The best use of an ESR meter is not to treat one displayed number as a verdict. Use it to make a fast, controlled comparison between the capacitor, its specification, its circuit role, and a known-good reference. That approach turns a compact measurement into a practical decision about what to repair next.

LCR Meter Selection for PCB Component Testing

A capacitor that reads correctly at 1 kHz can behave very differently at 100 kHz. An inductor may appear acceptable until its series resistance or parasitic capacitance becomes relevant. That is why an LCR meter is more than a convenient replacement for a digital multimeter when diagnosing components, validating incoming parts, or repairing populated PCBs. It measures impedance under a defined AC test condition and resolves that result into usable component parameters.

What an LCR Meter Measures

An LCR meter applies an AC test signal to a component, measures the resulting voltage and current relationship, and calculates impedance. From that impedance, it reports inductance, capacitance, or resistance, along with secondary parameters that help explain component behavior.

For a capacitor, the primary reading may be capacitance, while dissipation factor, equivalent series resistance, or phase angle can reveal loss mechanisms that a simple capacitance measurement misses. For an inductor, inductance and DC resistance are useful, but quality factor and series resistance can be equally relevant in filters, power stages, and RF circuits. For resistors, the instrument can identify resistance while also showing whether inductive or capacitive parasitics are influencing the result.

The reported value depends on the selected equivalent circuit model. Series mode is generally appropriate when a component’s series resistance dominates, such as many inductors and low-impedance capacitors. Parallel mode is often more appropriate for high-impedance components and leakage-dominated behavior. Selecting the wrong model does not necessarily make the meter inaccurate, but it can make the displayed equivalent value less useful for the application.

LCR Meter Test Frequency Determines Relevance

Test frequency is one of the first specifications to evaluate because it determines how closely a bench measurement reflects operating conditions. A 100 Hz or 120 Hz test is useful for many electrolytic capacitors and power-frequency applications. A 1 kHz measurement is a common general-purpose reference for capacitors and inductors. Higher frequencies are essential when assessing small ceramic capacitors, RF inductors, ferrites, and components used in switching circuits.

A meter with higher available test frequencies can expose behavior hidden at lower frequencies. ESR, dissipation factor, and inductance can all change substantially across frequency. At some point, a capacitor approaches self-resonance and no longer behaves primarily as a capacitor. An inductor can become capacitive above its self-resonant frequency. The objective is not always to test at the highest frequency available. It is to test at a frequency that matches the component specification, circuit function, or failure mechanism under investigation.

Test signal level also matters. Some ceramic capacitors are voltage-dependent, and ferrite-core inductors can show different behavior as excitation level changes. For sensitive semiconductor-adjacent work or low-level components, a controlled, low-amplitude test signal reduces the risk of measuring a condition that does not represent normal operation.

Choosing the Right Measurement Parameters

A useful meter should report more than an automatic L, C, or R result. Automatic component identification saves time during board repair and component sorting, especially when the value or package marking is unclear. Manual parameter selection remains valuable when a technician already knows what should be present and wants to compare a controlled reading across multiple boards or lots.

For capacitor work, capacitance, ESR, dissipation factor, and phase are the most common parameters. ESR is especially useful for diagnosing degraded electrolytic capacitors in power supplies, although ESR alone is not a complete capacitor health test. Capacitance loss, leakage, dielectric absorption, and behavior at the circuit’s operating frequency may still matter.

For inductors, examine inductance, resistance, quality factor, and phase. A winding can retain nominal inductance while developing excess resistance from damage, poor termination, or thermal stress. For resistors, resistance is usually sufficient, but phase information can help identify a component affected by surrounding circuit paths or an unintended reactive element.

In-Circuit Measurements Require Judgment

Testing directly on a populated PCB is often the fastest way to localize a problem, but an LCR meter measures every parallel path available at its test frequency. A capacitor across an IC supply rail may be measured alongside several other capacitors. A resistor may have alternate paths through semiconductors, pull networks, or transformer windings. The displayed result can be valid impedance data without representing the individual component value.

Start by comparing identical circuit sections or a known-good board whenever possible. A reading that differs sharply from a matching channel, rail, or component location is often more actionable than a reading compared only with a nominal datasheet value. If the circuit produces an ambiguous result, isolate one terminal of the component before making a final decision.

Component polarity and bias conditions require additional care. A standard LCR measurement is an AC small-signal test and does not replace leakage testing at rated voltage, semiconductor curve tracing, or powered-circuit analysis. Never apply an LCR meter to an energized circuit. Discharge capacitors first, particularly in power electronics, where stored energy can damage the instrument and create a safety hazard.

Fixtures and Contact Quality Affect Small Values

At low resistance, low inductance, and low capacitance, fixture effects can equal or exceed the component under test. Standard clip leads add lead inductance, contact resistance, and stray capacitance. Their effect may be minor for a large electrolytic capacitor but significant for a small SMD inductor or a picofarad-range capacitor.

Open and short compensation removes much of the fixture’s own contribution. Perform compensation using the same leads, probes, or tweezers that will contact the component, and repeat it when the fixture changes. Keep leads short, clean oxidation from probe tips, and apply consistent contact pressure. These basic controls improve repeatability more effectively than repeatedly measuring the same questionable contact.

For densely populated boards, tweezer-style probes provide a direct advantage. They contact both terminals of a chip component without long flying leads, reducing setup time and improving access between adjacent parts. Siborg’s Smart Tweezers and LCR-Reader instruments are designed around this workflow, combining handheld component identification with professional measurement functions for loose parts and PCB diagnostics.

Specifications That Matter When Selecting an LCR Meter

Basic accuracy should be read alongside the conditions under which it is specified. A 0.1% or 0.2% basic accuracy figure is meaningful only within the stated measurement range, test frequency, signal level, and calibration interval. Review accuracy charts for the capacitance, inductance, and resistance ranges that match the parts you actually handle. A meter may be highly accurate for midrange resistances while being less suitable for extremely low ESR or very small capacitance.

Resolution is not accuracy. Extra display digits can help observe trends, but they do not compensate for test-fixture limitations, temperature effects, or an unsuitable frequency. Look for stable readings, sensible auto-ranging behavior, selectable equivalent circuits, and secondary parameters that support the diagnostic task.

For professional use, calibration documentation matters. A NIST Traceable Calibration Certificate supports quality systems, incoming inspection records, and traceable maintenance programs. It also establishes a known baseline for the instrument. Calibration does not eliminate the need for daily verification with known standards or reference components, especially where tight tolerances affect production acceptance.

Data handling can also change the value of a handheld meter. Bluetooth or PC-connected measurement tools make it easier to record readings, compare component batches, document repair results, and keep measurements out of handwritten notes. That feature is most useful when the measurement process is standardized. Capturing inconsistent test conditions simply produces a more permanent inconsistent record.

Match the Instrument to the Workbench

For occasional through-hole work, a basic handheld LCR meter with suitable test clips may be sufficient. For PCB repair, SMD rework verification, and component sorting, direct tweezer access and fast auto-identification can save substantial time. For RF, switching-power, and precision production work, prioritize frequency range, accuracy at the required ranges, compensation capability, and repeatable fixtures over general convenience features.

A meter rated to 100 kHz or 250 kHz such as Lcr-Reader Multimeter R2, R3 MPA and MPB offer a different diagnostic range than an entry-level instrument limited to low-frequency testing. That does not make a low-frequency meter unusable. It means the buyer should align the instrument with the components and failure modes encountered most often. A power-supply repair bench, an RF design lab, and an incoming-inspection station do not need the same measurement profile.

Before relying on any reading, define the component type, expected value, relevant test frequency, fixture, and whether the part is isolated or in circuit. That short discipline turns an LCR measurement from a number on a display into evidence that can support a repair, acceptance decision, or design diagnosis.