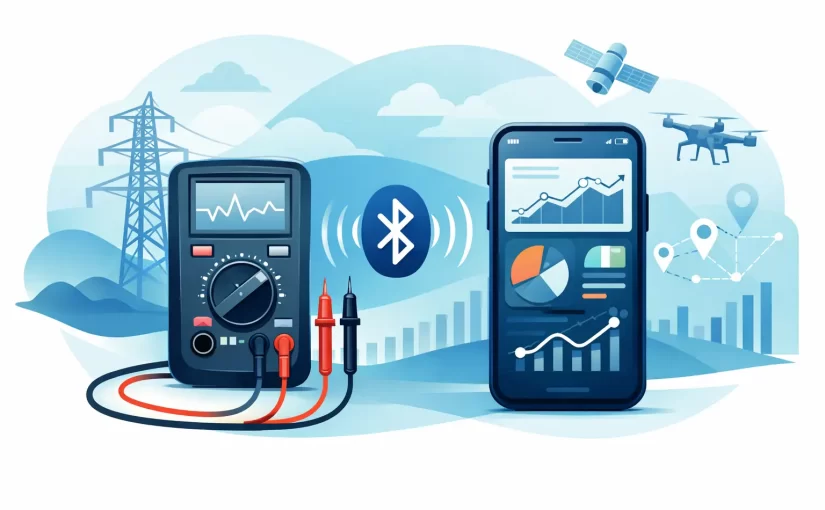
A meter reading that disappears when the probe moves is rarely enough to diagnose a field failure. Bluetooth multimeter logging converts individual readings into a time-stamped measurement record, giving technicians evidence of what a circuit did before, during, and after a fault condition. For troubleshooting intermittent power, verifying a repair, or documenting production checks, that record can be more valuable than a single value on the display.
What Bluetooth Multimeter Logging Actually Captures
Bluetooth logging sends measurements from a handheld meter to a phone, tablet, or PC application. Depending on the instrument and software, the record may include voltage, current, resistance, continuity state, frequency, temperature, timestamp, measurement range, and the selected function. The application can display a live trend, retain a table of readings, and export data for a service report or engineering review.
The practical benefit is not Bluetooth by itself. It is the ability to preserve changes that occur over time while keeping the meter at the measurement point. A technician can monitor a 24 V control supply while cycling a machine, observe battery voltage during a load event, or record resistance drift as a connector is flexed. The phone or PC becomes the display and record keeper, while the meter remains connected to the circuit.
This is particularly useful when the relevant event is brief. A meter may update its display fast enough to show that voltage changed, but not fast enough for the operator to read and write down the minimum value. Logging creates a record that can be reviewed after the event, compared against expected limits, and shared with the person responsible for the next diagnostic step.
Where Bluetooth Multimeter Logging Saves Time
Intermittent faults are the clearest use case. Consider a PCB assembly that resets only when a motor starts, a portable device that shuts down under transmit load, or a control cabinet that drops out once per shift. A single spot check may show normal voltage. A logged measurement can reveal a repeatable dip, its duration, and its relationship to the operating event.
Repair verification is another strong application. Before replacing a regulator, relay, harness, or battery pack, record the original behavior. After the repair, repeat the same test under the same load. The comparison is more defensible than a note stating that the circuit “appears normal.” For warranty work, maintenance records, and quality-control documentation, time-stamped data gives the repair a measurable baseline.
Production and incoming inspection teams can also use logging to standardize checks. Rather than having each operator transcribe readings manually, a defined procedure can capture the required measurements at a controlled interval. That does not eliminate the need for calibration, correct probe placement, or a documented test specification. It does reduce transcription errors and makes records easier to retrieve.
For PCB-level work, logging is most effective when paired with the correct measurement tool. A digital multimeter is appropriate for rail voltage, continuity, resistance, diode checks, and basic current measurements. When the task is identifying an unknown SMD capacitor, inductor, resistor, or ESR-related defect directly on a board, an LCR or ESR instrument provides measurement functions a conventional multimeter does not. The workflow should follow the component and failure mode, not the availability of a wireless connection.
Set the Logging Rate to Match the Fault
A common mistake is assuming that the fastest available logging interval is always best. It is not. Faster sampling produces more data, can consume mobile-device storage, and may not reflect the meter’s true measurement update rate. The usable rate depends on the meter’s conversion speed, the selected function and range, Bluetooth transmission behavior, and the application.
For slow changes, such as battery discharge, room-temperature drift, or a supply rail monitored over several hours, a one-second or longer interval may be sufficient. For a fault that occurs when a relay energizes or a device enters a high-load mode, use the fastest stable interval supported by the instrument and verify it with a known event.
There is also a boundary between logging and waveform capture. If the failure lasts microseconds or milliseconds, a digital multimeter log may show only an averaged value or miss the event entirely. An oscilloscope, data acquisition system, or instrument with an appropriate high-speed capture mode is then the correct tool. Some advanced portable test instruments combine multiple functions, but users should confirm the sampling and recording specifications for the mode being used.
Build a Measurement Record You Can Trust
A useful log begins before the first reading. Record the test point, circuit condition, expected value, meter function, range, and probe configuration. If measuring current, document where the meter is inserted and whether the circuit is operating normally with that series resistance. If using a temperature probe, identify its placement and attachment method.
The meter must also be suitable for the measurement. Basic accuracy, resolution, input impedance, burden voltage for current ranges, and safety category all affect the validity of a record. A highly detailed log cannot correct an inaccurate setup. For quality systems or regulated work, use an instrument with current calibration documentation, such as a NIST-traceable calibration certificate when required by the procedure.
Stability matters as well. Secure probes so that movement does not create false discontinuities or voltage spikes. For populated boards and fine-pitch work, dedicated probing accessories or tweezer-style instruments can improve repeatability by placing the measurement contact precisely where it is needed. On low-resistance circuits, consider lead resistance and contact resistance. On high-impedance nodes, consider probe loading and environmental contamination.
A short annotation at the right moment is often more useful than a larger data file. Mark events such as “motor start,” “heat applied,” “connector moved,” “battery load enabled,” or “firmware reset.” Without operating context, a trend graph can show a change but not explain why it occurred.
Bluetooth Connection Trade-Offs in the Field
Wireless logging adds convenience, but it introduces operating considerations. Bluetooth range varies with walls, metal enclosures, interference, and the orientation of the meter and mobile device. Keep the receiving device close enough to maintain a reliable connection, especially around industrial cabinets and equipment racks.
A dropped connection does not always mean the meter stopped measuring. It may mean the application stopped receiving data. Before relying on a logging setup for a long run, test how the instrument handles reconnection, whether measurements are buffered internally, and how gaps appear in exported data. A gap should be visible in the final record rather than silently replaced with estimated values.
Mobile devices require their own discipline. Disable aggressive battery-saving settings that may suspend the logging app, confirm that the device clock is correct, and protect the device from unauthorized access if measurement records include customer or production information. When the work is safety-critical, the technician still needs direct awareness of the live circuit. A remote screen is a convenience, not a substitute for safe procedures and proper personal protective equipment.
Turning Logs Into Diagnostic Evidence
After capture, review the data against the circuit’s expected behavior. Look for minimum and maximum values, rate of change, repeated patterns, and correlation with operator actions or load cycles. A 12 V rail that falls to 10.8 V may be acceptable in one design and unacceptable in another. The specification, not the graph alone, determines whether the result is a fault.
Compare like with like. Use the same test point, range, load condition, and logging interval when evaluating a repair against the original fault. If possible, capture a known-good unit under the same conditions. That reference often reveals whether the suspected anomaly is genuinely abnormal or simply normal operating variation.
For reports, retain the original data file and create a concise interpretation. State what was measured, when it was measured, what condition was applied, and what the data shows. A graph should support the finding, not replace it. For example: “The 5 V rail dropped below the controller’s minimum operating threshold for 1.6 seconds when the heater load engaged; replacement of the high-resistance supply connector eliminated the drop.”
Choose the Instrument Around the Work
Bluetooth capability should be evaluated alongside measurement performance. A logging function is only useful when the meter provides the required accuracy, ranges, functions, safety rating, and update behavior for the application. For electronics technicians, the decision may also include whether the job needs component-level LCR measurement, ESR testing, diode characterization, analog signature analysis, or oscilloscope capability in addition to standard DMM functions.
Siborg Systems designs compact test instruments for PCB and component work where direct access, repeatable measurement, and digital data capture matter. The right configuration depends on whether the primary task is tracking electrical behavior over time, identifying a component in circuit, or doing both as part of a structured repair process.
Start with one recurring diagnostic problem, define the event you need to capture, and test the logging setup before the next critical service call. A well-labeled record of a real fault is more useful than a folder full of readings with no operating context.